We (Catherine D’Ignazio and Rahul Bhargava) launched DataBasic.io2016; hoping to help other folks take a more creative, engaging and welcoming way to learn how to work with data. Why? Learn more in our blog posts about building a data cultureor building data literacy without complicated software. Hard to believe that was 2 years ago! We decided this January to share some of the ways we assess our impact. It is important to do this in public, to share our successes and own our weaknesses. So here is a quick review of some of the quantitative data about how people are using our online tools and activities.
This year we connected with new users, built out the DataBasic.io tool suite, and helped people of all backgrounds work with data in fun and interesting ways. In addition to launching Connect the Dots, which helps you see how your data is connected, we led numerous workshops. These included nonprofits like the Maine Data Initiative and the World Food Program, more than a hundred journalism students in Greater Boston, librarians in Michigan and Massachusetts, arts-based organizations like Theater Communications Group, and even middle school girls at Greenwich Academy in Connecticut.
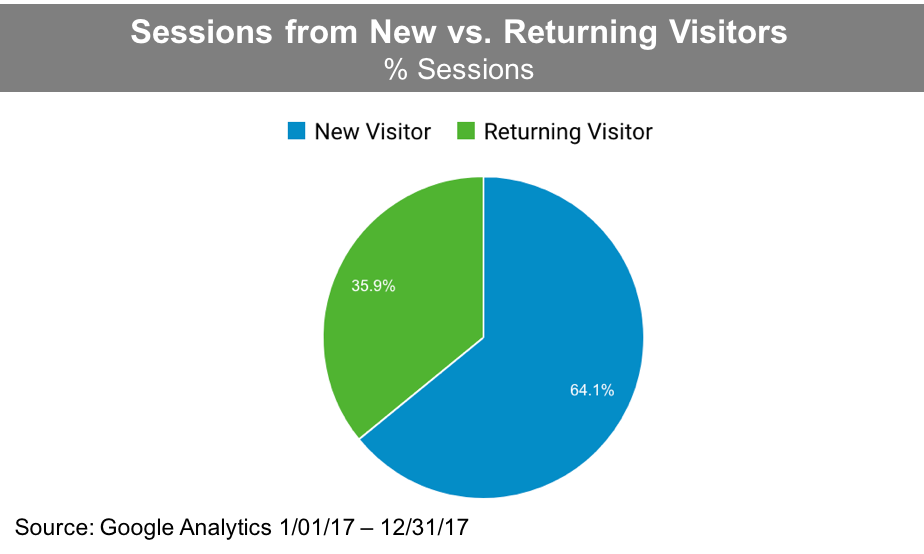
New users of DataBasic.io made up over ⅔ of our total 2017 audience
In 2017, DataBasic had over 18,000 new users! These new folks made up ⅔ of the total uses of our tools online. That is a lot of growth over the last year, so we are excited that the outreach we are doing is working!

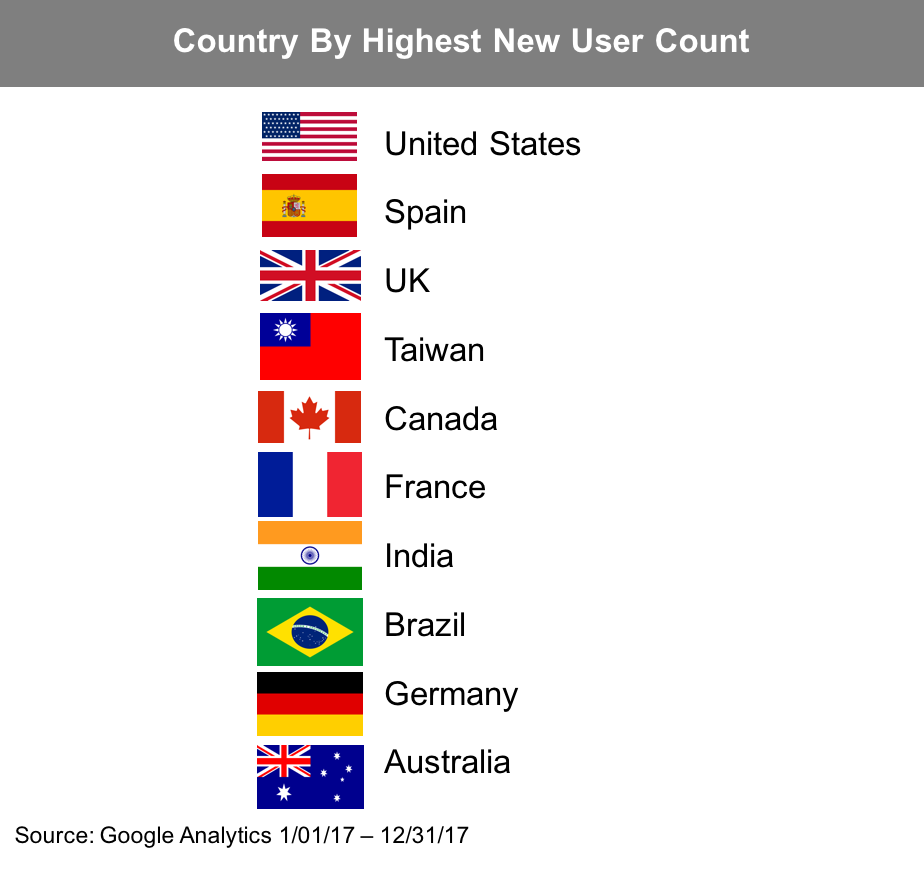
International visitors made up more than ½ of our total users
Surprisingly, just under half of new users came from the United States. We’ve built out our suite in Spanish and Portuguese, so we are trying to fill the need in other languages, but we still expected the majority of our users to be in the US. Over 50% of users in 2017 originated from countries like Spain, UK, and Taiwan. This suggests our audience is international, and perhaps that we should get some help translating our tools into French! We do this translation and localization work because we think it is super important to build tools for learners that are left out of the data hype right now, and our experience has taught us that non-English speakers make up a big chunk of that group. This data supports our approach and motivates us to continue to expand our multi-lingual approach.

People visiting the site are actually using it
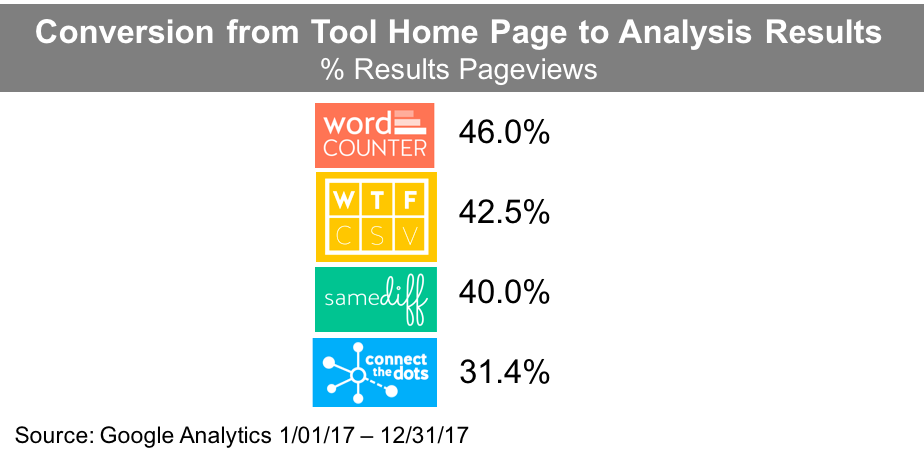
Websites online typically measure “conversion” rates, to assess how many people are going from a homepage to some kind of results that indicate they did something. For us, conversion is about whether people try out one of our tools or not (i.e. do they get to a page showing results of analyzing some data.) Across all our tools this hovers around 40%. That might sound low, but for the web it is a surprisingly high number! That tells us that something is working about the way we have built DataBasic.io. We’ll be doing some more qualitative analysis to understand why, but it is a great start to understand whatis happening with the quantitative data.
WordCounter, our approachable tool for analyzing text, was most heavily utilized in terms of number of users, number of sessions, and session duration. This isn’t too surprising, because it is the tool we use most in workshops. It is also worth mentioning that this list of conversion rates matches the order of tool links on our homepage from left to right. Perhaps we should put in some code to randomize this and see if it impacts which tools folks try out.

Folks are using our learning-centered features
We wrote an academic paper a while back about how and why we built DataBasic.io to support data literacy (read it in the Journal of Community Informatics). Now we have enough usage data to assess whether the design principles we describe are effective in practice or not. A quick and easy one to evaluate is the tool-tips feature we’ve included on vocabulary to be more inviting.
Tooltips saw healthy usage — more than two-thirds of of new users used at least one tooltip! Again, we have to do some qualitative interviews and such to understand why, but knowing that the engagement on these explanatory tooltips is so high suggests this particular feature is having an impact.
Coming Soon…
That’s it for now! If DataBasic.io is new to you, check out the hands-on activities and focused tools to help you introduce a data culture to your organization in interesting ways. Thank you for being a part of our journey in 2017.
Up next? Over the last few months we’ve been testing out new ways to help organizations run these activities themselves. 30 brave organizations from around the world partnered with us, and we’ve learned loads from how they tailor the activities to their specific needs. We’re putting all that learning and experience together into a self-service curriculum for organizations trying to build their capacity to work with data. We’re calling it “Data Culture Project”, and it’ll launch with an introductory webinar online this March! Totally free. Available online. So stay tuned….
Many thanks to Connie Yee for her work analyzing all this data.

